I have had a lot of teachers asking me recently how can they use their iPads more creatively with the children. This will be the first of many posts, as teachers ask I will post the ideas I have had. My first question is what topic are you doing?
Topic?
Aboriginal Art
What apps are on your iPad?
How can you use these apps?
Use Drawing Pad to create your own Aboriginal Art. Choose the black paper and the Felt tip to create patterns.
Share back to your photo album and insert into
Keynote, Comic Life, Pages or Book Creator - make a presentation of your own art, some examples of Aboriginal art you have found, information about the art,
Safari - Find images via Google, tap and hold on an image to either copy or save to Camera Roll. Don't forget to reference where the images came from.
Comic Life: choose the blank template then choose Collection under the Layout tab and tap on Maps layout, choose Australia and tap the photo icon in the centre of the map to insert your your own art work. Use Text boxes and picture boxes to cover up the parts of the map that shows other countries.
Showing posts with label Comic Life. Show all posts
Showing posts with label Comic Life. Show all posts
Tuesday, 20 August 2013
Wednesday, 21 September 2011
Infographics and Inquiry Presenting
All of my schools at the present are embroiled in Rugby World Cup fever. Students are researching and finding out information not only about their own country but also adopted countries. Soon they will need to present this information so I have been talking to teachers about how 'Infographics' are a great way to present student work.
Students will have created their research question, found their keywords and used the smart researcher tools to find information.
They will have copied photos or graphics to folders and the internet references to WordProcessor (Word, Pages, Google Docs) along with 'brief' notes copied from Internet pages that answer their research question. They will synthesise their notes and present facts and 'hopefully' they will present new ideas with conclusions and inferences.
I am gradually adding examples to Scoop.it that are suitable to show younger students.
Click on this link to see examples suitable to show students.
I will be following up with more posts on this subject as I develop ways of how to teach students how to find the right sort of information, graphics, symbols etc to suit their presentations.
Students will have created their research question, found their keywords and used the smart researcher tools to find information.
They will have copied photos or graphics to folders and the internet references to WordProcessor (Word, Pages, Google Docs) along with 'brief' notes copied from Internet pages that answer their research question. They will synthesise their notes and present facts and 'hopefully' they will present new ideas with conclusions and inferences.
Now how could they present it?
The following example has been created in Comiclife.
Or in PowerPoint
Or in Keynote
The following diagram lists all of the possible elements that could be included in an infographic
Or in Keynote
The following diagram lists all of the possible elements that could be included in an infographic
The criteria for an infographic presentation is
- Keep a balance between graphics, text, charts and numbers
- Be aware of what colours work well together, not too many and remember complimentary colours (opposites of the colour wheel)
- Check all of the time that you are answering your research question
- Reference your facts, graphics etc
- Include graphics, photos, graphs, flow charts, graphic organisers, statistics
- Add your own inferences from the information presented
For younger children you can simplify the criteria
Some of the programmes that would be suitable for creating infographics
- PowerPoint: more suitable then Word as all of the different objects will not move around randomly + version 2007 and 2010 have great Smart Art graphics
- Pages or Keynote (for Mac): easy to move objects around and place them
- ComicLife: great Title graphics, easy to create 'Chart' type infographics
- Kidspiration and Inspiration: Mindmapping type infographics
I am gradually adding examples to Scoop.it that are suitable to show younger students.
Click on this link to see examples suitable to show students.
Wednesday, 5 August 2009
Walk the Talk: Day Two - Computer Lab
Day Two:
All classes came into the lab and sat at the computers. To remind them of the sequence of the programme I had written a list on the Activboard
We revisited the Writing and Publishing Online Rules. Next we looked at the Xtranormal slideshow I had made, this was also a reminder of what they need to do. This is also an example of one of the types of publishing they are going to be doing this term.

For the rest of the session students worked on their Wordles and Copying/Pasting edited stories onto their wikipages.
 Some of the students have published wonderful Comic Life posters that have photos of children in them, but at the moment the school do not want to have the children’s photos online. So to publish them and protect anonymity we double click on each picture, click on the Details button
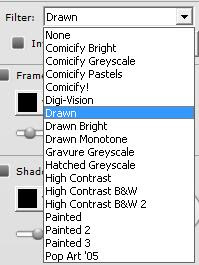
 and used one of the Filters to comicfy the pictures.
  .
.
Do this for each photo and the effect is that that you can still make out what the figures are doing, but you can't make out the faces.
One major teaching point this session was showing students how they could have multiple pages open on their browser.
I noticed that when they needed to go to a new website they would type over the address of the page they were on.
I demonstrated how they could press Command-T (Control-T) to open up a new page where they could type the address.
I also needed to remind them that they do not need to type the whole address, (miss out the http://www).
Routines have been set now, students now know how to respond when I need their attention 'Stop, look, listen' and they have already learned many new skills.
Next week the teachers would like their students to publish some writing they have finished. The week after that I will be starting Argument writing.
All classes came into the lab and sat at the computers. To remind them of the sequence of the programme I had written a list on the Activboard
- Come in
- Sit down
- Log on
- Open Server
- Open Wikispaces page
- Click on Sign in
- Type in User name
- Open Pages
- Type six lines of Home Keys asdf jkl;
- Choose a game from the Wikipage to play
We revisited the Writing and Publishing Online Rules. Next we looked at the Xtranormal slideshow I had made, this was also a reminder of what they need to do. This is also an example of one of the types of publishing they are going to be doing this term.

For the rest of the session students worked on their Wordles and Copying/Pasting edited stories onto their wikipages.
 Some of the students have published wonderful Comic Life posters that have photos of children in them, but at the moment the school do not want to have the children’s photos online. So to publish them and protect anonymity we double click on each picture, click on the Details button
 and used one of the Filters to comicfy the pictures.
  .
.Do this for each photo and the effect is that that you can still make out what the figures are doing, but you can't make out the faces.
One major teaching point this session was showing students how they could have multiple pages open on their browser.
I noticed that when they needed to go to a new website they would type over the address of the page they were on.
I demonstrated how they could press Command-T (Control-T) to open up a new page where they could type the address.
I also needed to remind them that they do not need to type the whole address, (miss out the http://www).
Routines have been set now, students now know how to respond when I need their attention 'Stop, look, listen' and they have already learned many new skills.
Next week the teachers would like their students to publish some writing they have finished. The week after that I will be starting Argument writing.
Labels:
Comic Life,
computerlab,
literacy,
Publishing,
walkthetalk,
WalkthetalkChapelDowns,
Writing
Monday, 6 April 2009
Walking the Talk Day Five

I haven't seen the children since Thursday last week (ran a course for teachers on the Friday!) I was interested to see if they could remember the routines, I was pleasantly surprised, everything ran as if I hadn't been away. This reinforces what I always say to
 teachers... if you have strong routines, high expectations, and well organised management (and a quiet voice) all students will respond well. It doesn't matter if they are decile one or ten, they still respond in the same way. I did this same 'teaching experience' in a decile one class a couple of years ago, and a couple of teachers that have visited so far have seen me 'in action' in both schools, using the same management techniques and children reacting in the same way.
Most of the students are using the mimio well and are quite capable of calibrating it. Surprisingly enough we do not have to calibrate that often (maybe 3 times a day) even though
 the projector sits on a table in the middle of the room. Students have become very adept at it.
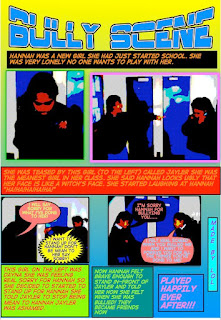
Everyday for writing I demonstrate a different way of publishing. Today I modelled Comic Life for Publishing. Children have used it before so several of them worked at it confidently. Some are working on Photo Story 3 (free for Windows), publishing on their wikipage or typing it up in Word or Pages with Borders, titles and their Superhero graphics. Some have published using the Publish button in Inspiration. One child has made a Podcast 'with a little help from his friends', all of which we will add to his wikispace.
I only have 3 more days left so I'm going to show them my 'Comic Slideshow' idea in PowerPoint and upload to Slideshare and how to create an iMovie in 3'easy' steps!
Update on Research topic: I think they get what I mean about creating Research questions and keywords. We will be searching for information tomorrow!
Wednesday, 19 November 2008
Comic Life and Slideshows

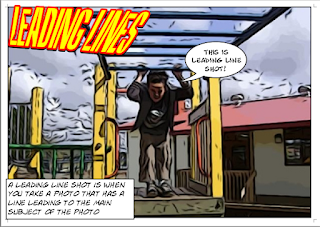
You can make slideshows of comic pages in comic life. Before you start turn the page to horizontal. Go to File - Page Format, click on Landscape.
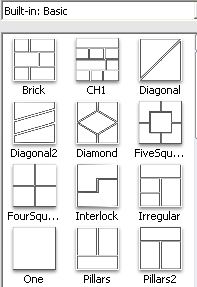
If this Library is not showing then click on the drop down menu and select Built in basic.
Click on the 'One' template and drag and drop on the page.
Drag your Photo in and add your text bubbles, headings and narrative text.
Add more pages with either 'One' template or with a template that has 2 or 3 spaces on it.
 Once you have completed all your pages and saved them, then export them as individual jpegs. Go to File - Export - Export to Images.
The individual pages will be exported as separate jpegs.
These can now be imported into Photo Story, MovieMaker, Keynote or PowerPoint. Add music and you have a comic slideshow.
Labels:
Comic Life,
comics,
Keynote,
literacy,
Photo Story,
PowerPoint
Subscribe to:
Posts (Atom)


